
How To Assess and Improve PowerShell Code Quality Using PSCodeHealth
What Is PowerShell Code Quality ?
Code quality is a vast and somewhat subjective notion, so what we cover here is my take on code quality for PowerShell and more specifically, the parts which underpin PSCodeHealth.
Instead of engaging in an abstract debate on what is quality, we’ll focus on attributes which can be observed and reasonably quantified by analyzing the code. This list of attributes is intentionally leaning to where PSCodeHealth can help.
High-quality PowerShell code tends to have the following characteristics :
It follows general best practices, language guidelines and conventions
For any given language/framework, communities build consensuses about what are considered good practices. For PowerShell, these include :
- Avoid using aliases in scripts/modules
- Avoid hard-coding credentials (especially in plain text) in scripts/modules
- Avoid using
Write-Host
Of course, there are exceptions to these rules but it is accepted that they should generally be followed. These rules exist for a reason, they prevent gotchas. For example, the 3 rules mentioned above help prevent the following (respectively) :
- Aliases tend to be less readable and lesser known than the full command name.
- Credentials in plain text can be read by anyone who can read the code and reused for malicious purposes.
- There are multiple reasons not to use
Write-Host, Jeffrey Snover, Don Jones and others have explained these reasons.
Conventions are immensely helpful : they lower the “barrier to understanding” for reviewers/contributors and they make developers more productive. The more developers follow them, the more useful they are. So do yourself and the community a favor : use established conventions, unless you have a documented reason not to.
To evaluate whether a piece of code follows sound practices and general language guidelines, this is where linting tools come in. In the PowerShell realm, we have PSScriptanalyzer.
It follows a consistent style
There are other practices which are more a matter of personal (or team) preference, like :
- Indentation
- Opening braces on the same line or a new line
- Capitalization
- Naming conventions (especially for variables)
The main rule for these type of practices is more akin to :
Pick a style and stick to it.
What matters here is consistency across a given file, module, project or team.
Consistency improves readability because anyone reviewing the code can train one’s eye to a given style aspects and use that to read the code more quickly.
Any exception to the consistent use of a given style practice will confuse, or at best, slow down the reader.
When working as part of a team, style consistency reduces the number of not-so-obvious and not-so-useful changes in source control, for example, commits consisting only in :
- Changing a tab into 4 spaces
- Adding or removing whitespace
- Changing a pair of double quotes into single quotes
You don’t want these silly little things to delay the merging of your pull requests, do you ?
Again, a linting tool, possibly with the addition of custom rules to match a specific style guide, can help greatly.
Single-purpose, short, simple functions
Single-purpose
A function should do 1 thing and do it well.
This makes the code modular and understandable, because it organizes it into logical, single-responsibility chunks. A function is basically a named code block and to contribute to this organization of the code, the name of a function should tell its purpose.
Functions should generally follow PowerShell cmdlets Verb-Noun naming convention and this helps keep them single-purpose. If multiple verbs could be used for a function name, this function is doing more than 1 type of operations and it should be split up. If we need an “And” or many words to compose a descriptive noun for a function, it is most likely doing too many things.
Short
The most obvious argument goes back to readability.
There is another argument in favor of short functions : it forces the developers to extract a lot of code into other functions, which are logically scoped, tightly focused and … short. Also, a function containing many calls to other functions with intent-revealing names can read like a narrative. We all love a good story, right ?
Simple
What is a simple function ?
What is a complex function ?
Why does it matter ?
Well, I already wrote a detailed PowerShell-specific answer to these questions, so I invite you to take a look at it.
Documented
There is a reason I use the term “documented” and not “commented”. Too much inline comments can clutter the code and can actually make it less readable.
Inline comments should :
- Be used only when necessary
- Not state the obvious
- Used to explain the logic, not the syntax
- Not be needed if the code is clear, idiomatic and uses intent-revealing names
You don’t have to take my word for it :
The proper use of comments is to compensate for our failure to express ourself in code.
Robert C. Martin — Clean Code : A Handbook of Agile Software Craftsmanship
On the other hand, there is a place where comments belong : comment-based help.
Public functions should contains comment-based to provide the user a quick access to documentation (via Get-Help). Even private functions benefit from comment-based help, the only difference is the audience : code reviewers, maintainers or contributors instead of users.
Testable and tested
Again, we are opening a Pandora’s box because testing is a huge topic and has diverse, far-reaching implications. In the context of PowerShell, testing is pretty much synonymous with Pester, so that’s what we focus on here.
Tested
To summarize, effective tests provide :
- Proof that the code works as intended/expected
- Early detection of code defects (the later a defect is detected, the harder it is to fix)
- Fast feedback on whether code changes are breaking existing functionality
There many other benefits, but essentially, they boil down to less defects and more confidence.
Anyone making code changes can run the tests to know immediately if the changes are breaking existing functionality or not. This makes changing code easier and safer, which is ultimately what maintainability is all about.
Testable
PowerShell functions which are easy to test (particularly unit test) have the following attributes :
- Short
- Simple
- Tightly focused (they have a single, well-scoped responsibility)
- Loosely coupled to their dependencies
Does this ring a bell ? It should, because : these attributes are also attributes of high quality code.
This is why thinking about the tests during code design (or before, for those into TDD) tends to lead to higher quality code.
Now that we are on the same page regarding the characteristics which make up PowerShell code quality and maintainability, let’s look at how PSCodeHealth can help us measure these characteristics.
Generating a PSCodeHealth Report For a PowerShell Project
PSGithubSearch is a cute little PowerShell module I wrote a while back, but I’m concerned about its quality and maintainability, so we are going to use it as an example.
PSCodeHealth report as a PowerShell object
Let’s start by creating a PSCodeHealth report for all the PowerShell files ('*.ps*1') in the project and store it into a variable for later use :
C:\PSGithubSearch> $Params = @{Path='.\PSGithubSearch\'; TestsPath='.\Tests\Unit\'; Recurse=$True}
C:\PSGithubSearch> $HealthReport = Invoke-PSCodeHealth @Params
C:\PSGithubSearch> $HealthReport

Files    Functions        LOC (Average)    Findings (Total) Findings         Complexity       Test Coverage
                                                            (Average)        (Average)
-----    ---------        -------------    ---------------- ---------------- ---------------- -------------
2        5                128.2            0                0                15.2             71.29 %
The default formatting view provides basic information for the overall project, but there is more :
C:\PSGithubSearch> $HealthReport | Select-Object -Property '*' -Exclude 'FunctionHealthRecords'


ReportTitle                   : PSGithubSearch
ReportDate                    : 2017-09-29 13:23:30Z
AnalyzedPath                  : C:\PSGithubSearch\PSGithubSearch\
Files                         : 2
Functions                     : 5
LinesOfCodeTotal              : 641
LinesOfCodeAverage            : 128.2
ScriptAnalyzerFindingsTotal   : 1
ScriptAnalyzerErrors          : 0
ScriptAnalyzerWarnings        : 1
ScriptAnalyzerInformation     : 0
ScriptAnalyzerFindingsAverage : 0.2
FunctionsWithoutHelp          : 0
NumberOfTests                 : 27
NumberOfFailedTests           : 0
FailedTestsDetails            :
NumberOfPassedTests           : 27
TestsPassRate                 : 100
TestCoverage                  : 71.29
CommandsMissedTotal           : 89
ComplexityAverage             : 15.2
ComplexityHighest             : 30
NestingDepthAverage           : 2.4
NestingDepthHighest           : 3
For more information on these metrics and which aspects of quality they attempt to quantify, please refer to this documentation page.
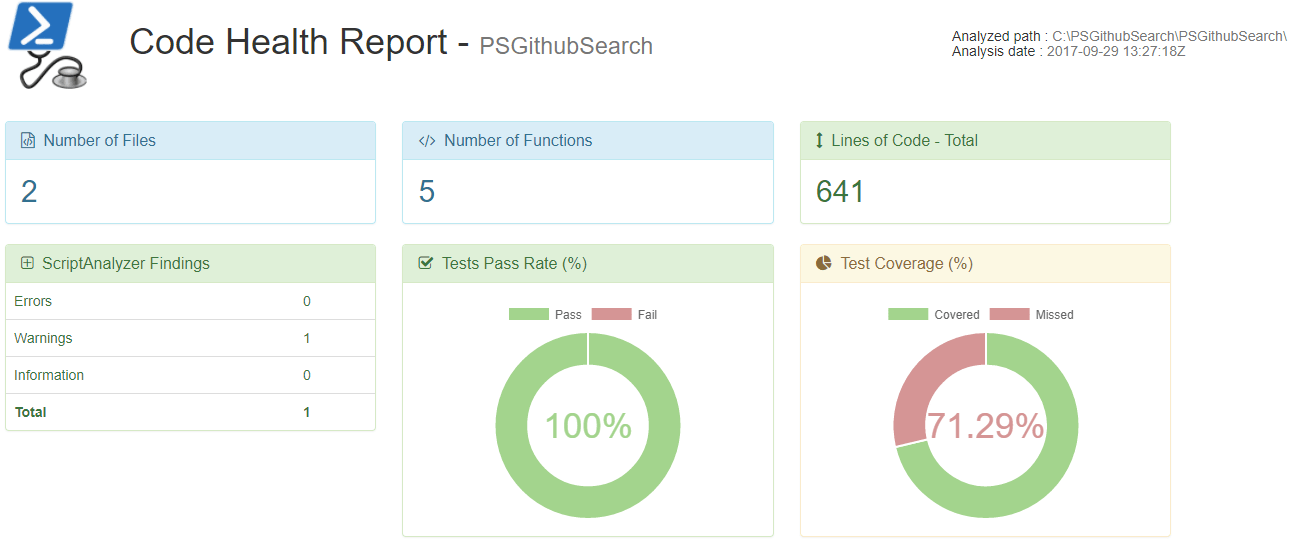
PSCodeHealth HTML report
This raw data is nice but a dashboard-like HTML report would probably be a nicer way of viewing where this project is doing well and where it needs improvement. We can do that using the HtmlReportPath parameter :
C:\PSGithubSearch> Invoke-PSCodeHealth @Params -HtmlReportPath 'C:\HealthReport.html'
Here is what the Summary tab of the report looks like :
The Summary tab is just an overview, the sidebar provides access to more specific sections of the report :
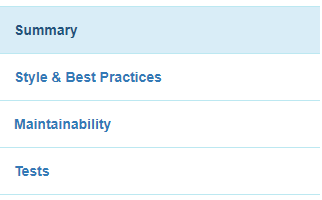
To see it in action, you can play with a live version of this report.
Interpreting a PSCodeHealth Report
The report’s color-coding is straightforward :
- Green means good
- Yellow means warning
- Red means danger
It is designed to provide at-a-glance information about which aspects and sections of the code need attention or improvement.
Style & Best Practices tab
The section of the report focuses on PSScriptAnalyzer findings and comment-based help. There is only 1 finding in the whole project so this is fine.
Maintainability tab
Functions length
The average number of lines of code per function (128.2) shows up in red, so it must be bad. How bad ?
The compliance rule for this metric gives us a good idea :
C:\PSGithubSearch> Get-PSCodeHealthComplianceRule -MetricName 'LinesOfCodeAverage'

Metric Name                   Metric Group       Warning          Fail Threshold  Higher Is
                                                 Threshold                        Better
-----------                   ------------       ---------------- --------------  ---------------
LinesOfCodeAverage            OverallMetrics     30               60              False
So this means that this metric starts to show up in yellow from 30 (lines of code per function) and in red from 60. This metric is over twice the “danger” threshold ! This needs improvement, a lot of it.
The Per Function Information table tells us which particular function(s) we should focus on to improve the project’s overall maintainability.
We can see that the most serious offender is Find-GitHubIssue with 219 lines of code. Ouch !
Complexity
We can see that the maximum cyclomatic complexity is green, which is good, but the average is yellow. Why ?
C:\PSGithubSearch> Get-PSCodeHealthComplianceRule -MetricName 'ComplexityHighest','ComplexityAverage'

Metric Name                   Metric Group       Warning          Fail Threshold  Higher Is
                                                 Threshold                        Better
-----------                   ------------       ---------------- --------------  ---------------
ComplexityHighest             OverallMetrics     30               60              False
ComplexityAverage             OverallMetrics     15               30              False
At 15.2, the average complexity is slightly above the warning threshold, but still, this is worth looking into. Once again, the Per Function Information table points at Find-GitHubIssue as the main offender, so we definitely need to take a hard look at this function.
Nesting depth
Regarding nesting depth, all functions in the project are green, so we are good.
Tests tab
Tests failures
All 27 unit tests in this project have passed, so let’s move along.
Tests code coverage
These tests exercise 71.29 % of the project’s code. The panel containing the overall “Test Coverage” chart is yellow which means this metric is at warning level. For more information, we can look at what the compliance rule has to say about that :
C:\PSGithubSearch> Get-PSCodeHealthComplianceRule -MetricName 'TestCoverage' -SettingsGroup 'OverallMetrics'

Metric Name                   Metric Group       Warning          Fail Threshold  Higher Is
                                                 Threshold                        Better
-----------                   ------------       ---------------- --------------  ---------------
TestCoverage                  OverallMetrics     80               70              True
This yellow is actually dark orangish because the tests code coverage is close to the danger zone.
Coverage can vary widely from 1 function to another so it is probably a good idea to look at the Per Function Information table to see if there are low-hanging fruits (functions for which we could easily and significantly increase coverage).
Get-NumberOfPage has only 41 % of its code exercised by unit tests. This is low, but I’m not too worried about it because it is just a private helper function and it is short and simple.
Find-GitHubIssue on the other hand, is a public function. 65 % test coverage is fairly low, but is that a low-hanging fruit ? I’m afraid not because, as we have seen, this function is huge and has a high cyclomatic complexity. This metric has an inverse correlation with testability, because it tells the number of code paths that tests need to cover.
Missed commands
This measures the code which is not covered by tests, but in absolute number rather than in percentage.
Also, because Pester code coverage feature uses commands as the unit of code (instead of lines), that’s what PSCodeHealth uses.
89 may look like a lot, but it is OK, as far as PSCodeHealth is concerned :
C:\PSGithubSearch> Get-PSCodeHealthComplianceRule -MetricName CommandsMissedTotal

Metric Name                   Metric Group       Warning Threshold    Fail Threshold      Higher Is Better
-----------                   ------------       -----------------    --------------      ----------------
CommandsMissedTotal           OverallMetrics     200                  400                 False
This is because the compliance rule uses a 1000 commands project as its baseline and our current project is smaller than that. This shows that relative metrics (in percentage) are generally more meaningful.
Now that we know which aspects and sections of code affect the project’s quality and maintainability, we can use this information as a guide when improving its code.
Using PSCodeHealth To Improve Code Quality and Track Our Progress
The HTML report made it very clear that the functions in this project are too long. It also made the function Find-GitHubIssue stick out like a sore thumb, so this is where we’ll start our refactoring endeavor.
A refactoring example
At the beginning of the function, we see this :
    [string]$QueryString = 'q='
    $EmptyQueryString = $True

    If ( $Keywords ) {
        $QueryString += ($Keywords -join '+')
        $EmptyQueryString = $False
    }
    If ( $Type ) {
        If ( $EmptyQueryString ) {
            $QueryString += 'type:' + $Type
            $EmptyQueryString = $False
        }
        Else {
            $QueryString += '+type:' + $Type
        }
    }
    If ( $In ) {
        If ( $EmptyQueryString ) {
            $QueryString += 'in:' + $In
            $EmptyQueryString = $False
        }
        Else {
            $QueryString += '+in:' + $In
        }
    }
    If ( $Author ) {
        If ( $EmptyQueryString ) {
            $QueryString += 'author:' + $Author
            $EmptyQueryString = $False
        }
        Else {
            $QueryString += '+author:' + $Author
        }
    }
    If ( $Assignee ) {
        If ( $EmptyQueryString ) {
            $QueryString += 'assignee:' + $Assignee
            $EmptyQueryString = $False
        }
        Else {
            $QueryString += '+assignee:' + $Assignee
        }
    }
    ...
    ...
This doesn’t even show everything, this list of If statements goes on and on…
What a convoluted way of building a query string ! This section of code alone, represent 121 lines of code and a cyclomatic complexity of 26.
On top of that, to build this query string it is using a concatenation operator (+=). Every. Single. Time. Which is inefficient.
Each variable tested in these If statements is used to build a search qualifier string. Almost all of these are built using the same pattern :
variable name in lower case + ‘:’ + variable value.
So we should be able to leverage this pattern against a collection of variables, instead of one at a time, to reduce repetition.
Also, all these variables are coming from the function parameters, so we can use $PSBoundParameters. And because they don’t have a default value, we know that if they are not in $PSBoundParameters, they are Null. This means we don’t need to check for Null and can get rid of all these If :
If ( $Variable ) {
    ...
}
First, we remove the parameters used by search qualifiers not following the pattern identified above ($Keywords, $Labels and $SortBy) :
If ( $PSBoundParameters.ContainsKey('Keywords') ) {
    $Null = $PSBoundParameters.Remove('Keywords')
}
If ( $PSBoundParameters.ContainsKey('Labels') ) {
    $Null = $PSBoundParameters.Remove('Labels')
}
If ( $PSBoundParameters.ContainsKey('SortBy') ) {
    $Null = $PSBoundParameters.Remove('SortBy')
}
Then, we use the pattern against all the remaining parameters to build search qualifier strings :
[System.Collections.ArrayList]$JoinableFilterStrings = @()
Foreach ( $ParamName in $PSBoundParameters.Keys ) {

    $JoinableFilterString = '{0}:{1}' -f $ParamName.ToLower(), $PSBoundParameters[$ParamName]
    $Null = $JoinableFilterStrings.Add($JoinableFilterString)
}
Also, each if the original If statements have a nested If/Else :
If ( $EmptyQueryString ) {
    $QueryString += 'variable:' + $Variable
    $EmptyQueryString = $False
}
Else {
    $QueryString += '+variable:' + $Variable
}
This checks whether the query string is empty to determine if we need to prefix the search qualifier with a '+'. Every. Single. Time.
To get rid of these repetitive checks, we can use the join operator with the '+' separator :
$JoinedFilterStrings = If ($JoinableFilterStrings.Count -gt 0) {$JoinableFilterStrings -join '+'}
$JoinedFilter = ($KeywordFilter, $JoinedFilterStrings, $LabelsFilter -join '+').Trim('+')
$KeywordFilter and $LabelsFilter are built prior to the $JoinableFilterStrings because they are built from a different pattern.
We join them with $JoinableFilterStrings even if they are Null or empty. In that case, the joined string would have a leading and/or trailing '+'. This is easily solved with the Trim method. No need for Null checks and these numerous If/Else anymore.
Quantifying the improvement
Now, we can generate a new PSCodeHealth report and verify the progress we’ve made :
C:\PSGithubSearch> $NewReport = Invoke-PSCodeHealth @Params
C:\PSGithubSearch> $IssueFunction = $NewReport.FunctionHealthRecords.Where({$_.FunctionName -eq 'Find-GithubIssue'})
C:\PSGithubSearch> $IssueFunction | fl *

FunctionName                : Find-GitHubIssue
FilePath                    : C:\PSGithubSearch\PSGithubSearch\PSGithubSearch.psm1
LinesOfCode                 : 130
ScriptAnalyzerFindings      : 0
ScriptAnalyzerResultDetails :
ContainsHelp                : True
TestCoverage                : 87.5
CommandsMissed              : 7
Complexity                  : 12
MaximumNestingDepth         : 2
We have ruthlessly axed almost 100 lines of code from this function, it feels good.
Initially, the cyclomatic complexity of this function was 30. By removing a large number of repetitive If and Else statements, we reduced it to 12.
Interestingly, this led to a substantial boost in test coverage (87.5 %). The exact same unit tests are now covering more code in that function. The main reason is that we have greatly reduced the number of code paths, so the tests have fewer paths to cover. This is a great example of the relationships between different types of metrics, in this case : cyclomatic complexity and tests code coverage.
Of course, there is a lot more refactoring work to be done, for example :
- Extract this whole query string building logic into a separate function
- Reuse the same query string building logic in the other functions
- Extract the handling of the API requests throttling into a separate function
- Reuse the function handling the API requests throttling from the other functions
These refactoring decisions and the work required to make them happen are still the developer’s responsibility. PSCodeHealth is just a tool to provide some guidance about where to focus and to help quantify improvements of the code.
Metrics have limitations :
There is no perfect metric. Any metric can be gamed one way or another.
So the focus should not be on improving metrics for the sake of improving metrics, but improving what they attempt to measure.
Conclusion
PSCodeHealth is considered stable, but not necessarily feature-complete. If there are additional metrics and features you would like to see, the preferred feedback channel is GitHub issues, but any type of feedback is welcome to make this tool more useful to more people.
Also, you might disagree with the tool’s default warning and/or danger thresholds for some metrics. This is perfectly fine, an upcoming article will show how to customize metrics rules to your project’s goals or requirements, and use this as a quality gate in a PowerShell release pipeline.
The easiest way to install PSCodeHealth is the PowerShell Gallery and you can get the code from GitHub. For more information on how to use this tool and its features, check out the fairly extensive documentation.
Comments
Robert Eder
While I agree that functions should be single purpose, which would encourage small functions, I do not agree with using an arbitrary number of lines to measure it. Such a threshold assumes that a single purpose function will be under the threshold.
In addition, many styles for readability increase the number of lines in a function. Splatting is one. Another example is when you are calling a function within your function that has many parameters, you would have a line per parameter. An arbitrary threshold potentially encourages sacrificing readability.
Another potential side effect is unnatural division of functions that make it difficult to determine what the functions are doing. Although, this is very rare. Most tend to add everything we can into a function.
As for the question on how to measure single purpose and small functions, I don’t have a good solution that would be scripted. It would require some kind of AI. Although, I am a strong supporter for scripting, I believe the better solution is still peer code review. But, that doesn’t stop me from looking for a way to script it.
Mathieu Buisson
Hi Robert,
I tried to set the metrics thresholds the least arbitrarily as possible. Unfortunately, there is no consensus right now in the PowerShell community on how many lines can be considered too much.
So I had to resort to other sources : the thresholds from other code quality tools targeted at other languages : Java, C#, Python, Ruby, etc…
It turns out the threshold at which a function (or a method) is considered long is fairly consistent across code quality tools and many different languages. So if there is legitimate reason for PowerShell to be an exception, it needs to be proven.
That said, these metrics thresholds cannot be set by 1 single person, but should be based on input from the PowerShell community at large. So I’m glad you raise the subject here and if you have suggestions, I invite you to join the discussion on this issue.
Yes, it is absolutely possible to reduce the number of lines and make the code less readable as a result of that. Someone who wants to game the metric will always find a way to do it. This is true for any metric.
A metric is just a metric and a tool is just a tool. It doesn’t exempt us from using our own judgment. And as I said in the article above, we should not write code for metrics, but for the qualities that the metrics attempt to quantify.
The tool doesn’t force you to split up functions in an unnatural way. It is your choice, your design and your craft to decide how you structure and modularize your code in a way that make sense to you (and hopefully to others).
Leave a Comment
Your email address will not be published. Required fields are marked *