
Using Azure Monitor Workbooks to document your Azure resources
The Problem
Azure makes it very easy to deploy resources in various ways and contexts :
- deployed by humans or automated processes
- run/managed by different teams
- to support different applications/workloads
- billed to different cost centers or subscriptions
- in different geographical locations
- in different environments/purposes (dev, QA, staging, production…)
It is so easy to spin up resources that, without appropriate governance, this can quickly lead to resource sprawl.
An aspect of Azure governance which is often overlooked is :
Which resources are running and where ?
What is the type, configuration, SKU of these resources ?
In other words, how do we build and document an inventory of Azure resources ?
Sure, this can be done in a Confluence page or any kind of wiki, but as resources and environments are created, modified, deleted by different teams and processes, how can we keep this documentation up-to-date ?
Any document which relies on human intervention is unlikely to keep up with the rate and variety of change, and it will eventually become stale.
A solution is to build a self-updating report about the Azure resources we have running, regardless of how/why they were provisioned and the Azure region and subscription in which they are located.
Introducing Azure Monitor Workbooks
Azure Workbooks is a service which allows to build reports using text (in markdown) and a number of data visualization types (tables, charts, tiles, etc…). The data can come from various sources (logs, metrics, alerts, etc…) and is obtained using KQL queries.
As its name implies, this service lives under the Azure Monitor umbrella and it is typically used to create reports like :
- performance analysis
- incident reviews
- troubleshooting guides
But because Azure Monitor Workbooks can also run KQL queries against the Azure Resource Graph, we can also use it to build an inventory of our Azure resources.
Azure Monitor Workbooks provides templates readily available in the portal, to get started quickly. The built-in templates cover a good number of scenarios, but not for our specific use case, so we are going to create a workbook from scratch.
This workbook will enable us to gather a few relevant properties on the following types of resources, across all environments and all subscriptions :
- App Services
- SQL Databases
- Virtual Machines
Let’s do this.
Creating the Workbook Resource
- In the Azure Portal, go to the Monitor service
- In the Monitor menu click on Workbooks
-
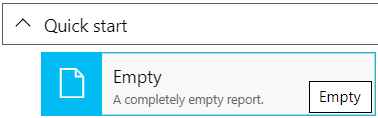
From here, we can view the built-in templates, but in our case, we select Empty :
We add an introductory section for the report, just to have some content to save.
- Click on Add text
-
Add the following markdown :
 # Environments Inventory

 ⚠️ _Select a **Resource Group** in the drop-down below_
The first line acts as the report title. The second line is a note on how to interact with the report (more on that later).
- Click on Done Editing
- Verify that the rendered markdown displays as expected in the report
Now, we save the report as a workbook resource.
- Click on the Save As button
-
Fill out the following fields :
- Title : This is the user-friendly name of the workbook
- Subscription : The Azure subscription where we want to save the workbook resource
- Resource group : The resource group where we want to save the workbook resource.
Make sure that users and stakeholders who need to view this inventory report have at least the Reader role on this resource group. - Location : It defaults to the location of the destination resource group.
I would recommend to leave it that way. - Save To : After selecting a resource group, we have the ability to choose Shared reports.
This is what we want, in order to make our report available to others.
-
Click on Save
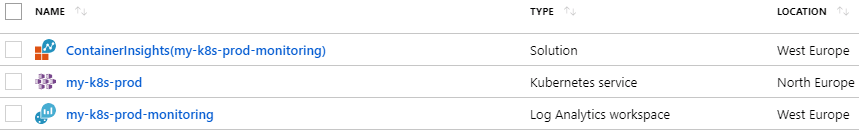
Now, if we go to the destination resource group, we can see the corresponding resource :
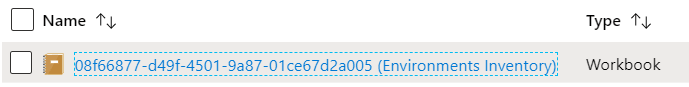
Note:
Clicking on this resource merely provides access to the resource metadata.
To view or edit the workbook, we need to access it from Azure Monitor. - In the Azure Portal, go back to the Monitor service
-
You should see the saved workbook in Recently modified workbooks :
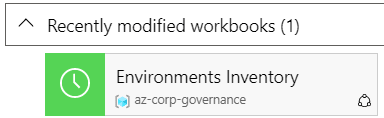
- Click on the saved workbook to open it
- Click on the Edit button to switch to editing mode
Next, we are going to flesh out our Azure resources inventory report.
Building the Azure Resources Inventory Report
In our scenario, Azure environments have a 1-to-1 relationship with a resource group and these resource groups follow a basic naming convention :
{Environment_Type}-corp-{Environment_Location}
For example, the resource groups names are :
- dev-corp-europe
- dev-corp-us
- test-corp-us
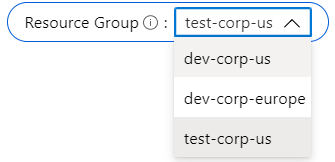
In the workbook, we want the user to be able to interactively choose which environment to look at.
We can achieve this with a parameter.
Parameterizing the Report
- Click on Add parameters
- Click on Add parameter on the top left corner on the section editing box
-
Specify the parameter properties like so :
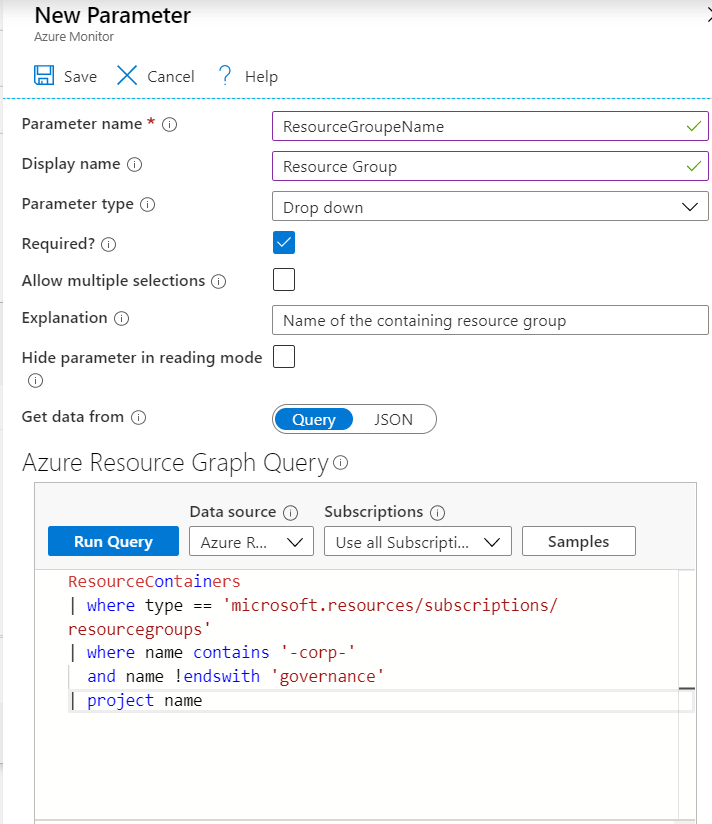
Some of these fields warrant an explanation.
- Parameter type : The type of UI to allow the user to specify a value for this parameter. In this case, we want a drop down menu.
- Get data from : Where the possible values in the drop down menu should come from.
This can be static data (a JSON array), or dynamic data (based on a KQL query).
In this case, it is based on a query, since we are going to query the Azure Resource Graph to get a list of resource groups. - Data source : Azure Resource Graph
-
Subscriptions : Use all subscriptions, unless you want to restrict this query to specific subscriptions.
Warning:
All KQL queries in a workbook are executed whenever we interact with the workbook.
They are run under the credentials of whoever is viewing the workbook, so they return only resource groups and resources that the user has access to (at least Read permission). -
The actual query :
Note:
While teaching KQL is out of scope for this article, we are going to expand on some noteworthy elements of the queries, just so we understand what is happening.
For more information on KQL, please refer to the documentation.This query gets all the resource groups, then it filters them based on our naming convention.
Then, weprojecttheirnameproperty, because this is the only property we need for the drop down menu items.
- Click Save to save the settings for this parameter
- Click Done Editing
Now, we can test the UI for this parameter :
Adding a Section for App Services Inventory
We start off with a short text block, containing the section title and a bit of usage information.
- Click on Add text
-
Add the following markdown :
## App Services : 💡 _Click on a resource name to go to the resource in the portal, or click on a URL to go to the web app in your browser._ - Click on Done Editing
Now, we gather the data we need regarding the Azure App Services (in the resource group specified via the ResourceGroupeName parameter) and present the data in a table.
- Click on Add query
- Change the Data source to Azure Resource Graph
- For Subscriptions, select Use all Subscriptions
- Leave Visualization and Size at their default value
-
In the query text box, add the following query :
 Resources
 | where resourceGroup == '{ResourceGroupeName}'
 | where type == 'microsoft.web/sites'
 | project ["Web App"] = id,
   ["App Service Plan"] = tostring(properties.serverFarmId),
   Kind = kind,
   URL = strcat("https://", properties.defaultHostName),
   ["SKU Name"] = properties.sku
Remember our
ResourceGroupeNameparameter ?
The second line above shows how to reference the value of this parameter from queries in the workbook.In this section we are only interested in App Services, so we filter on the type
microsoft.web/sites.Then, we use
projectto define the columns we want. We have to use square brackets and quotes whenever a column name contains spaces.As you might have guessed,
strcat()is a function which allows to concatenate 2 or more strings. Here, we use it to derive the web app URL from its defaultHostName property. -
Click Done Editing
We can now admire the result of our query :
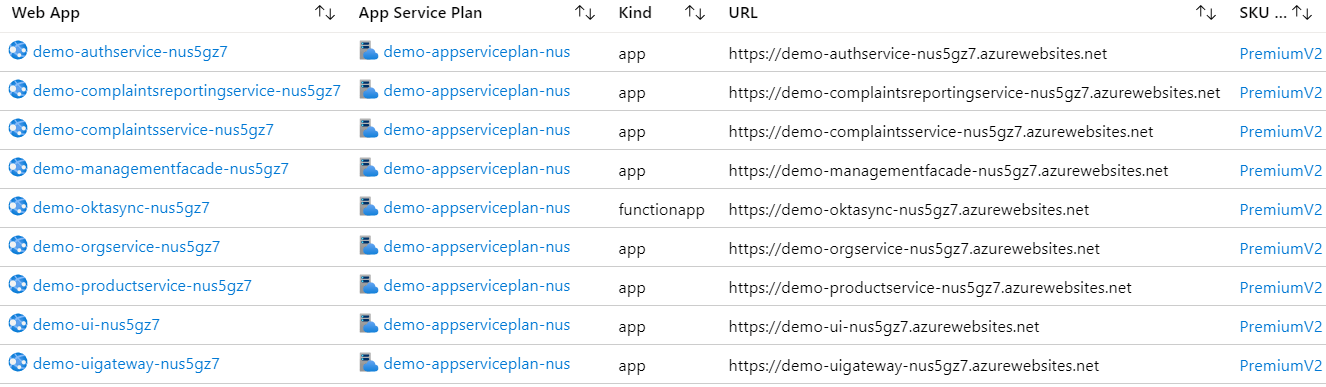
Note that values in the Web App and App Service Plan columns are automatically displayed as links and clicking on any of these brings us to the underlying resource in the Azure Portal.
Unfortunately, this is not the case for the URL column. But we can easily remediate that. - Click the Edit button at the bottom right of the App Service table
- Click on Column Settings
- Select URL (Automatic)
- Set Column renderer to Link
- Set View to open to Url
- Click Save and Close
Now, we can browse to the actual application by clicking on its URL value in the table.
Adding a Section for SQL Databases Inventory
We start off with a short text block, containing the section title and a bit of usage information.
- Click on Add text
-
Add the following markdown :
## SQL Databases : 💡 _Click on a resource name to go to the resource in the portal_ - Click on Done Editing
Now, we gather the Azure SQL Databases information (from the specified resource group) and present it in a table.
- Click on Add query
- Change the Data source to Azure Resource Graph
- For Subscriptions, select Use all Subscriptions
- Leave Visualization at its default value
- Set Size to Small, unless you have about 6 or more databases per environment
-
In the query text box, add the following query :
 Resources
 | where resourceGroup == '{ResourceGroupeName}'
 | where type == 'microsoft.sql/servers/databases'
 | where name != 'master'
 | project Database = id,
   ["Elastic Pool"] = tostring(properties.elasticPoolId),
   ["SKU Name"] = sku.name,
   ["Pricing Tier"] = sku.tier,
   Status = properties.status
In this section we are interested in SQL Databases, this is why we filter on the type
microsoft.sql/servers/databases.
We filter out the master database because it is not relevant to our applications.Then, we use
projectto expose the database properties we want and define the table’s columns. - Click Done Editing
The resulting table might not look as cute as Baby Yoda, but still looks pretty nice :
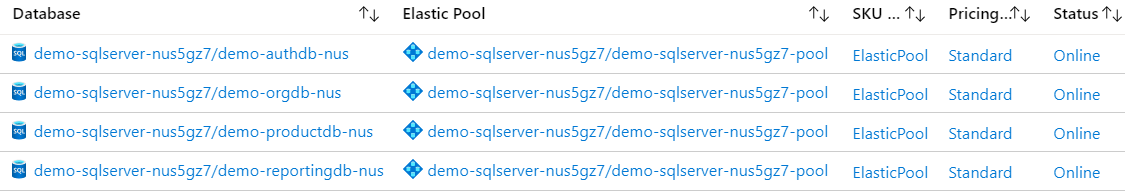
Again, the Database and Elastic Pool columns allow us to browse to the underlying resource in the portal, since their values are displayed as links.
Adding a Section for Virtual Machines Inventory
We start off with a short text block, containing the section title and a bit of usage information.
- Click on Add text
-
Add the following markdown :
## Virtual Machines : 💡 _Click on a Virtual Machine name to go to the resource in the portal_ - Click on Done Editing
Now, we gather the data relevant to Virtual Machines (in the specified resource group/environment) and present it in a table.
- Click on Add query
- Change the Data source to Azure Resource Graph
- For Subscriptions, select Use all Subscriptions
- Leave Visualization at its default value
- Set Size to Small, unless you have about 6 or more VMs per environment
-
In the query text box, add the following query :
 Resources
 | where resourceGroup == '{ResourceGroupeName}'
 | where type == 'microsoft.compute/virtualmachines'
 | project Name = id,
   Size = properties.hardwareProfile.vmSize,
   ["OS Image"] = strcat(properties.storageProfile.imageReference.offer, " - ", properties.storageProfile.imageReference.sku),
   associated_nic = extract(".*/(.*)\"}$", 1, tostring(properties.networkProfile.networkInterfaces[0]))
 | join kind = leftouter (
   Resources
   | where resourceGroup == '{ResourceGroupeName}'
   | where type == 'microsoft.network/publicipaddresses'
   | project ["Public IP Address"] = properties.ipAddress,
     associated_nic = extract(".*/networkInterfaces/(.*?)/.*", 1, tostring(properties.ipConfiguration.id))
   ) on associated_nic
 | project-away associated_nic, associated_nic1
In this section we are interested in Virtual Machines, so we filter on the type
microsoft.compute/virtualmachines.Then, we use
projectto define the table’s columns.
For the OS Image column, we usestrcat()to construct a user-friendly OS image name, based on the imageofferandskuproperties.Also, for VMs which have a public IP address, we want to show that IP address in a Public IP Address column.
Sadly, the Virtual Machine object returned by the query doesn’t contain any reference to the Public IP, so we need to run another query specifically for Public IP addresses and thenjoinits results with the Virtual Machines query.In the Virtual Machines query, we use the
networkInterfacesnested property to get the first NIC. This is safe in this case, because we know that our VMs only have 1 NIC.
Then, we use a regex toextract()the name of the network interface.So, the Public IP addresses query needs to have 2 columns :
- 1 column containing the information we ultimately want : the Public IP address
- 1 column that we can
joinon : the name of the network interface
We use the
ipConfigurationnested property to get the resource ID of the network interface which is associated with the Public IP.
Then, we use a regex toextract()the name of the network interface.Now, we have 2 queries which have a column in common (same name :
associated_nicand same value), so we can join these 2 queries on this column.
Note that this is a left outer join because our left query (Virtual Machines query) is the main one : we keep the Virtual Machine data even if there is no match in the Public IP addresses query. - Click Done Editing
Here is what the VMs table looks like :
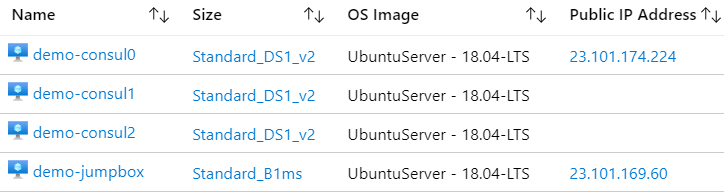
Again, clicking on a VM name brings us to the underlying resource in the Azure Portal.
We can add more sections to inventory other types of resources : Azure Storage accounts, Virtual Networks and subnets, Automation runbooks, the list goes on…
At this point, we have a fairly good grasp of the basic building blocks :
- Markdown blocks to add structure and any additional information to the report
- Azure Resource Graph queries to get and present data about our Azure resources
So let’s consider our workbook done and save it.
- Click on the Done Editing button at the top of the screen
- Click the Save button
Sharing the Azure Resources Inventory Report
We have 2 options to share the report with others users and stakeholders :
- Pinning some (or all) of the sections to an Azure Portal dashboard
- Sharing a link to the workbook
To pin all sections of the workbook to a dashboard :
- Click the Edit button at the top of the workbook
- Click the Pin button
- Click the Pin All button
- Click the Done Pinning button
To share the link to the workbook :
- Click the Share button at the top of the workbook
- Below the Link to share field, click the Copy button
- Send the copied URL to any users who may be interested in viewing this report.
It is a crazy long URL, so you might want to use a URL shortener service and share the shortened URL instead.
That’s it, we now have an inventory report of our Azure resources for multiple environments, across all subscriptions.
This report is interactive : the user can choose which environment/resource group to look at, and sort the data on any table’s column.
More importantly, the report will always be up-to-date since the queries to get the data are executed whenever we view the report.
Off course, this was just a fairly simple example, the report can be added to and customized at will.
With just 2 types of building blocks (markdown and KQL queries), the possibilities are almost endless.
To learn more on data sources, visualization types and capabilities offered by Azure Monitor Workbooks, please refer to the excellent documentation.
Leave a Comment
Your email address will not be published. Required fields are marked *